Technical Guide to the TAD-2 Wind Tunnel
9. Test Results Representation
9.1 Test Protocols
Test protocols are created in ASCII text format. Typical protocol sample is shown in Fig. 9.1. At the pressure distribution investigations the results are given as the graphs and tables of dependences of mean air pressure coefficients from the entering angle of dynamic pressure г=f(β).
Each protocol is available at the moment the test run is finished.
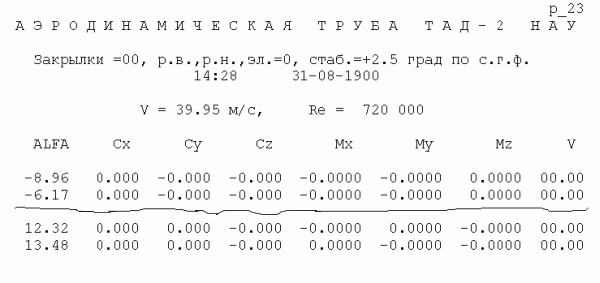
Figure 9.1 Typical Protocol Sample of Six-Component Force Testing
9.2 Data Plotting
Typical data graphics includes aerodynamic coefficient vs. angle-of-attack (sideslip) plots or mean air pressure coefficients vs. entering angle of dynamic pressure. On the customer demand, each plot can contain several series of curves for different configurations and/or test conditions. Relevant information, helpful for data analyses is putted onto the plot.
Additional processing of obtained data can include curve approximation using different functions, aerodynamic derivatives calculation, etc.
9.3 Technical Report
Usually after test program (or its part) is complete, the technical report or technical note is submitted to the customer. This contains detailed information, specified in technical task for the work and is usually available within one or two weeks.
9.4 Storage Media
Typically, test data are printed on paper in a form of technical report (note) and in electronic mode. On the customer request the test data can be passed over the Internet
| 
 Ukr
Ukr