Technical Guide to the UTAD-2 Wind Tunnel
9. Test Results Representation
9.1 Test Protocols
Test protocols are created in ASCII text format. Typical protocol sample is shown in Fig. 9.1. Each protocol is available at the moment the test run is finished.
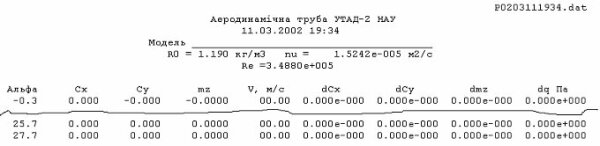
Figure 9.1 Typical Protocol Sample of Three-Component Force Testing
9.2 Data Plotting
Typical data graphics includes aerodynamic coefficient vs. angle-of-attack (sideslip) plots. On the customer demand each plot can contain several series of curves for different configurations and/or test conditions. Relevant information, helpful for data analyses is put onto the plot.
Additional processing of obtained data can include curve approximation using different functions, aerodynamic derivatives calculation, etc.
9.3 Technical Report
Usually after test program (or its part) is complete, the technical report or technical note is submitted to the customer. This contains detailed information, specified in technical task for the work and is usually available within one or two weeks.
9.4 Storage Media
Typically, test data are printed on paper in a form of the technical report (note). Additionally a PC-formatted 1.44 MB floppy disk with test protocols is submitted. On the customer demand all the data including report, plots, photos and other information can be written to CD-ROM, 100 MB Zip disk or transferred via the Internet.
| 
 Ukr
Ukr